CoreScore reads a company’s financial statements and answers three questions for the bank specialist: could this company default on the loan, how likely is it, and why? Lower-risk applications progress faster, higher-risk cases surface early, and specialists can focus their time on borderline cases.
CoreScore · Live System
Live screens
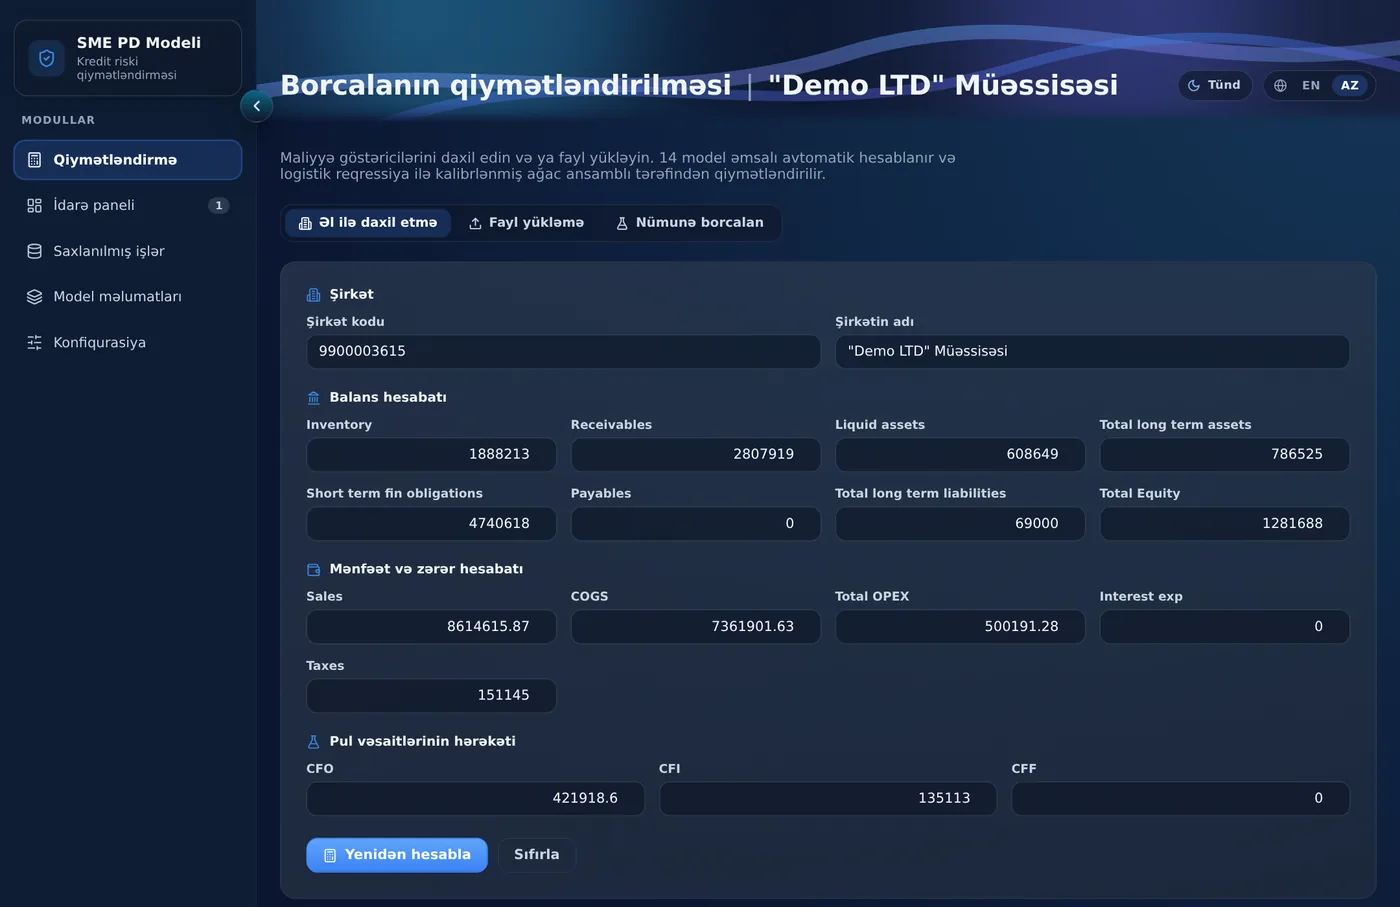
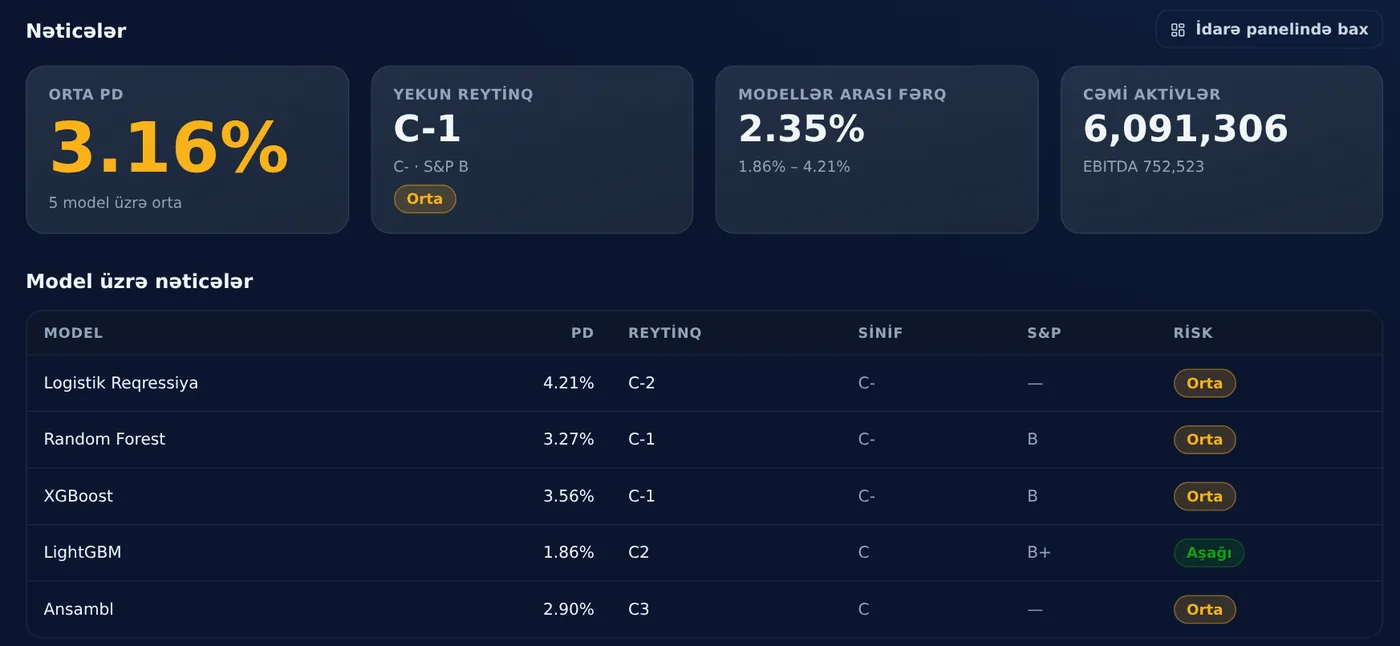
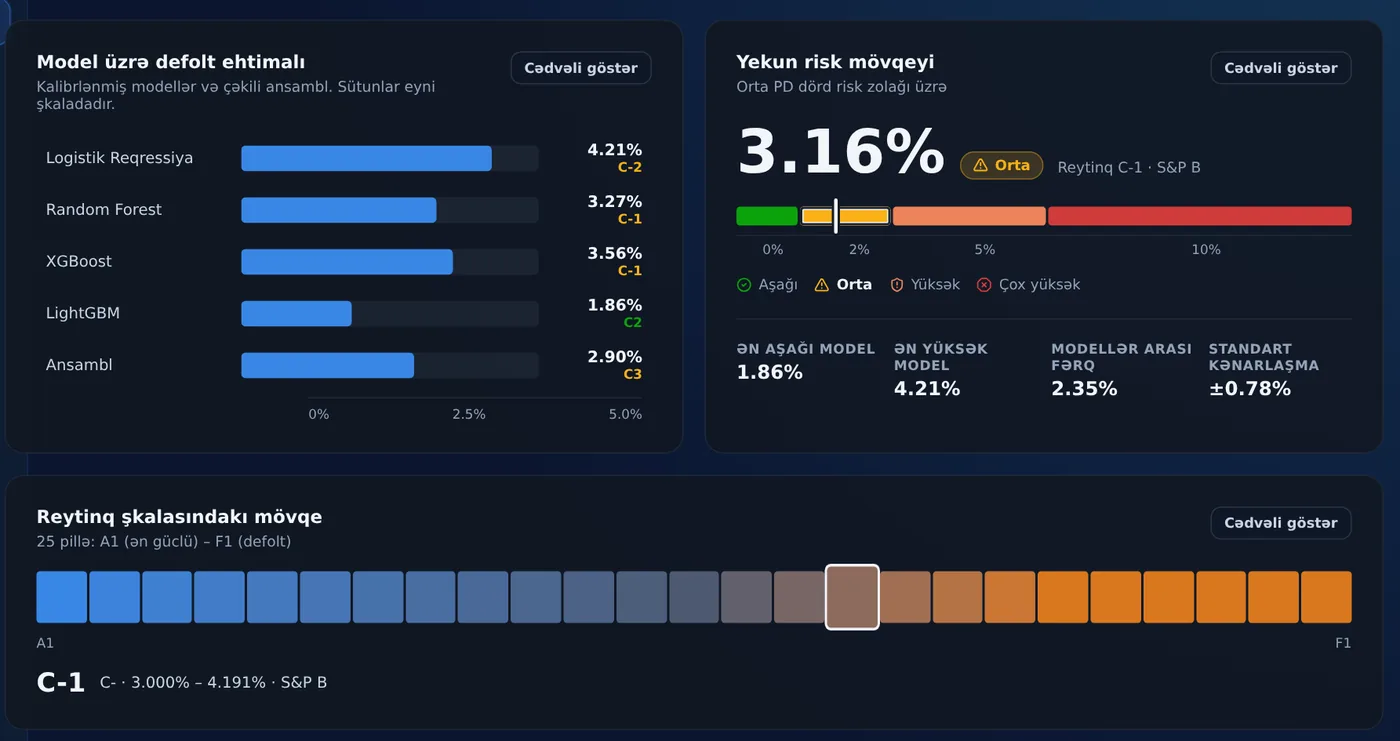
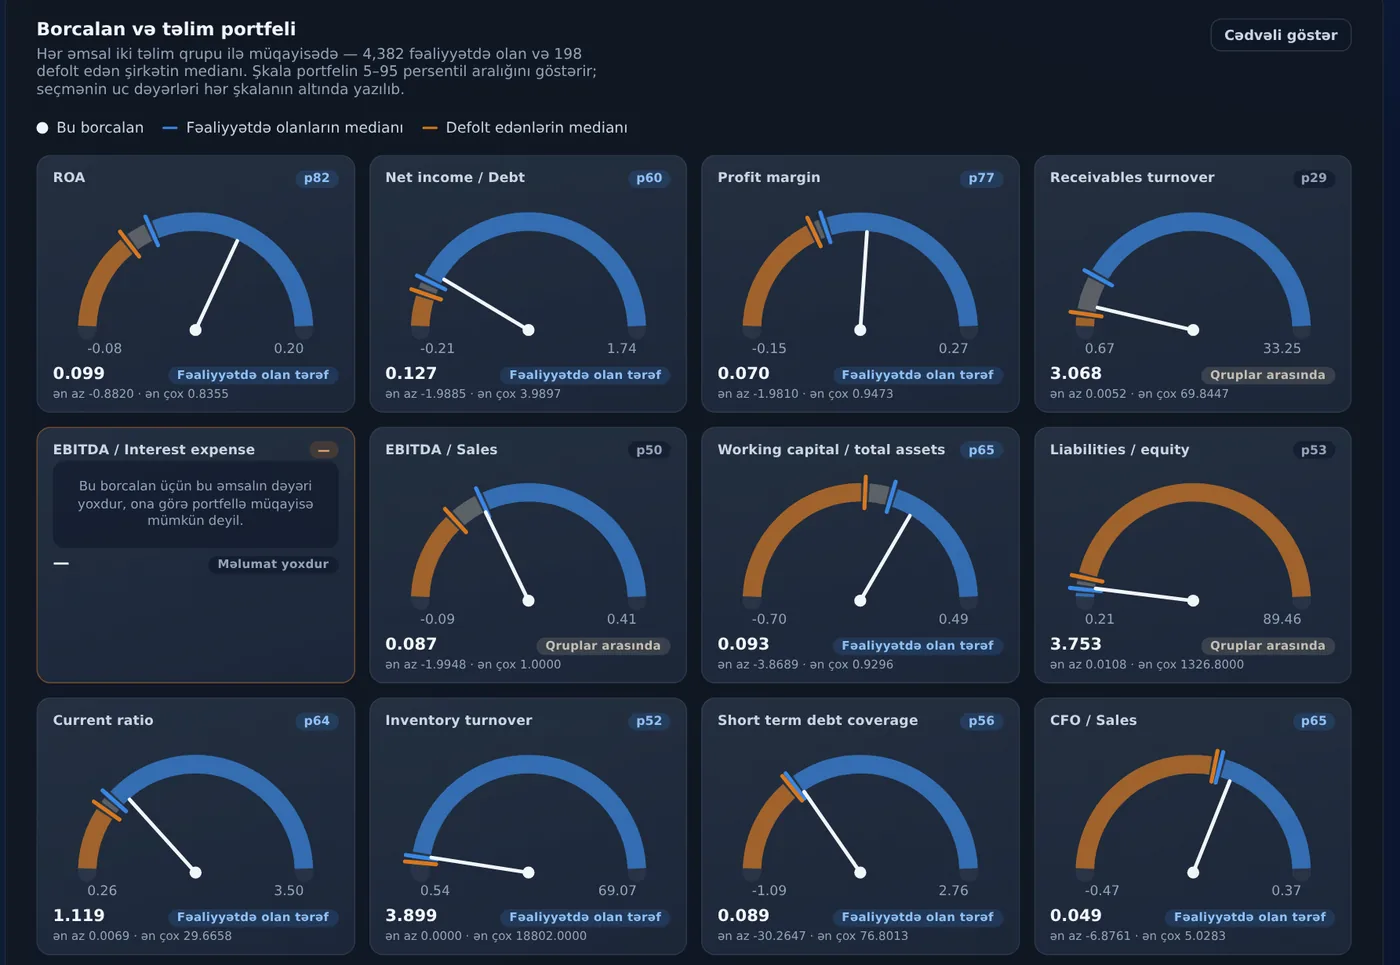
The specialist uploads the applicant company’s balance sheet, income statement, and cash flow statement, or enters the figures into the form. The bank already requests these documents.Average probability of default: 3.16%; rating: C-1; risk zone: Medium. Five models are shown side by side, all ranging from 1.9% to 4.2%, indicating consensus.The probability is displayed on a four-color risk bar and a 25-level rating scale. The credit committee can see the company’s position at a glance.Each indicator is benchmarked against thousands of companies: the blue side is closer to companies that repaid, while the orange side is closer to those that defaulted. This answers the question: “Why this result?”
What do banks face when lending to small and medium-sized businesses?
Hours of Work per Application
Reviewing the statements, conducting an on-site visit, interviewing management, and going through committee approval. A single SME application takes a specialist 8–15 hours, even though the outcome of many cases is clear from the start.
A Growing Queue Requires a Growing Team
As application volume grows, the bank must either hire more specialists or accept longer waiting times. Business owners wait weeks for an answer and may turn to a competing bank.
Same Case, Different Outcome
Two specialists may assess the same company differently. Without consistent criteria, explaining decisions and measuring portfolio quality become more difficult.
Small Loan, High Analysis Cost
The loan amount is small, but the cost of analysis is high. Banks may therefore decline SME applications or serve the segment at a loss.
Four Steps: From Financial Statements to a Decision Recommendation
No documents are required beyond those the bank already requests.
01
Upload the statements
Upload an Excel file or enter the figures into the form: balance sheet, income statement, and cash flow statement.
Input: three financial statements
02
Let the System Analyze Them
Fourteen financial indicators are calculated automatically: profitability, debt-servicing capacity, turnover, and cash flow.
14 indicators · zero manual calculations
03
Let the System Assess Risk
The model compares the company with the outcomes of thousands of real businesses and estimates its probability of default.
Probability of default + rating
04
Receive a Decision Recommendation and Credit Opinion
The application is assigned to a traffic-light risk zone, and the specialist adds an explanatory credit opinion to the case as a PDF.
Zone · reasons · PDF
It Doesn’t Replace the Underwriter—It Clears the Queue
CoreScore divides applications into three streams. The figures below were measured on 4,580 real companies the system had never seen before.
Fast track
Most reliable 30%
0.87%
actual default: 1 in 115 companies
Simplified procedure. Only 6% of all problem loans fall into this zone.
Specialist review
Middle 50%
2.84%
actual default: 1 in 35 companies
Standard analysis, but the specialist starts with pre-calculated indicators, benchmarks, and a draft opinion.
Stop / review
Riskiest 20%
13.2%
actual default: 1 in 8 companies
This zone contains 61% of all problematic loans. Conduct an in-depth review or decline the application.
The portfolio’s average default rate is 4.32%. The red zone is three times riskier than average, while the green zone is five times safer. The bank sets the zone thresholds according to its own risk appetite.
A Day in the Credit Department with CoreScore
Analyzing Financial Statements Manually in Excel
Initial Assessment in Seconds
Fourteen indicators, a risk score, and a rating are ready as soon as the report is uploaded.
Specialist-Dependent Decisions
The same criteria for every application
Every company is assessed using the same rules. Results can be compared and tracked.
A black-box number
Every figure is explained
The system shows which indicators increase risk and where the company stands relative to businesses that repaid or defaulted.
Writing the opinion from scratch
Ready-to-Use Credit Opinion
AI converts the result into a clear Azerbaijani narrative. The specialist can edit it and download it as a PDF.
Scattered files and notes
A traceable record of every assessment
All applications and results are stored in the database. Auditors and the risk team can revisit them at any time.
More applications mean more staff
More loans with the same team
Routine applications leave the queue, allowing specialists to focus on genuinely borderline cases.
How Reliable Is the System?
We put the system to the test. We showed it financial statements from 4,580 real companies but withheld whether those companies later repaid their loans. We then compared the system’s predictions with the companies’ actual outcomes. The results:
8 out of 10
Identifies high-risk companies
There are two applications on your desk: one company will later default, while the other will repay. The system correctly identifies the problematic one in 8 out of 10 cases.
44%
Problems are concentrated
Nearly half of all defaulted loans—88 out of 198—are found among the 10% of applications the system ranks as riskiest. Closer review of this 10% can help prevent half of potential losses.
5 → 5
Predicted Default Rates Match Actual Outcomes
If the system says that 5 out of 100 similar companies will default, approximately 5 also default in practice. This makes the estimate useful for planning interest rates and provisions.
5 opinions
Cross-Checks Its Own Results
Each application is assessed using five separate methods: conventional bank scoring based on logistic regression and four modern models. When all five agree, confidence in the result is higher. When they disagree, the system warns the specialist to review the company more closely.
The system was tested on companies it had never seen—not on the companies it was trained on.
These are not training results; they are test results. During the pilot, the same validation is repeated on the bank’s own loan portfolio.
Technical metrics for the risk team
The Bank Always Makes the Final Decision
System
Provides a recommendation
Probability, rating, risk zone, and reasons.
Specialist
Makes the decision
The specialist may disagree with the recommendation and record the reason.
Archive
Everything is recorded
The figures used, who made the decision, and when.
Risk team
Monitors quality
Model accuracy is monitored over time and the model is updated when needed.
We offer a completely free 4–6-week pilot project.
The pilot does not affect live credit decisions. The system runs in parallel with specialists, allowing the bank to validate the results using its own data.
Week 1
Discovery
The application flow, document formats, and current process are reviewed.
Week 2
Customization
The model is calibrated using the bank’s historical loan data.
Weeks 3–4
Parallel run
Real applications are processed, while decisions continue to be made exclusively by specialists.
Weeks 5–6
Results
Accuracy, hours saved, distribution across risk zones, and the implementation plan.
Why inCore
A Working System
This is not a research project: the web system is ready and available for a live demonstration.
Transparent methodology
Indicator selection, calibration, and validation are fully documented and can be presented to the regulator.
Our In-House Team
The model, software, and support are delivered by inCore’s own specialists.
Local support
Direct access to our Baku-based team throughout implementation, pilot, and operation.